Prev Up Top Next Contents
4.6 Importing maps
therion can import cave maps for which you do not have the
suvery data [thwiki 6].
To put together scraps drawn on digitized images of maps for which
the survay data are not available, you need to have some
reference point on each scrap. These can be arbitrary stations,
for example, ie, points that you mark on the map (before digitizing
it) and treat as a station.
To this aim you need:
- to digitalize the cave map with a scanner;
- for each image to define the position of a (virtual) station.
This is the station where the map connects with the rest of the cave.
- to define a "survey" with this station, if it does not appear
already in another survey of the cave;
- to create a new scrap into which you import the map image as background;
- to define the scale and the rotation of this image in the scrap:
if the image has a scale-bar (eg, the 10 m bar), you can use the two
little red squares with it, just like for the cross-sections.
Place (drag with the mouse) the squares on the ends of the scale-bar
and sets the coordinates to (0,0) and (X m,0) where X is the length of the
bar, in meters. Remember that the 'x' coordinate points towards east
and the 'y' coordinate points towards north.
- draw the scrap, using the scanned image.
Add a point of type "station" for the connection station
and set it the option "-visibility off", so that it does not appear
in the maps;
- use the "join" command to connect the scrap to the others.
4.6.1 Example
This example uses fictitious data
Suppose to have a map image file, nodata.gif.
Create a new map file, nodata.th2, for the scrap with no survey.
In the data file
nodata.th define the "survey"
nodata with the
single virtual station "1", and "equate" it to a real station of
the cave survey.
You do not have to define a centerline.
   survey nodata
     input nodata.th2
   endsurvey

   equate 1@nodata 4@s1

   join linea_sx@nodata:0   s1_sxf@s1:end
   join linea_dx@nodata:end s1_dxf@s1:0
In the file nodata.th2 import the image nodata.gif as background.
Next create the scrap (id "scrap_nodata"), specify its projection ("plan")
in the "Scraps" control, and use the little red squares to define the
scale and the orientation of the scrap.
Add a point of type "station" for the virtual station "1".
Draw the lines of the scrap and all the other symbols and texts.
Finally connect this scrap to the others with the "join" command
as shown in the above code.
The figure shows the scrap and the final result.
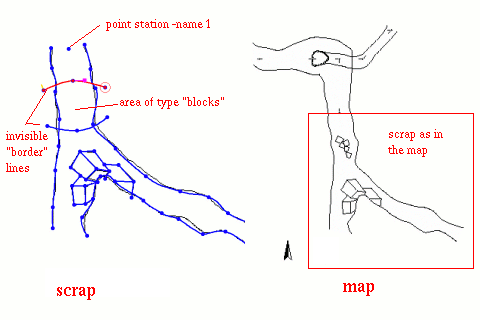
Fig. 66. Scrap without survey
A final note.
If you have the real (geographic) coordinates of two points in the
map, you can set the scale (and rotation) of the imported map
using the
fix command in a survey data file,
   fix point1 X1 Y1 Z1
   fix point2 X2 Y2 Z2
In this way the imported scraps get also vertical information, which
makes the map coloring by altitude possible.
4.6.2 Using reference points
The reference points used to join the scraps do not have to be stations.
If you have a coordinate grid on the map, you can set the real
X,Y coordinates (in some geographic coordinate system, or in an arbitrary
map reference system) of two points
in the scrap. Use the xtherin map editor, under the Scrap tab.
This will calibrate the scrap, ie, defines its orientation and scale.
If you calibrate all the scraps in this way they will correctly
placed on the map. If you use a geografic coordinate system for the
real coordinates of the reference points, add the -cs option to the
scraps (for example -cs UTM32).
For example you digitize the portions of the map. Next you open the
xtherion map editor and create new th2 files, one for each image,
with its scrap. You calibrate the scrap by dragging the red arrow endpoints
on two points of the coordinate grid and by writing the points real
coordinates in the Scrap control. You might need to adjust the zoom to
see the arrow. Then you draw the scrap with all its features.
No need to add station points.
In the source file, or directly in the
thconfig file, you write a
survey that inputs the map files and with the appropriate join commands.
For example the following code is included in the
thconfig,
The figure below shows the xtherion map editor opened on a scrap
(the top part of the map). The map image has a black grid and the cuts
that delimit the end of the portion are marked by the two red dashes,
drawn on the map image. The scrap has walls (violet), a pit line (blue)
and a water-flow point. The red arrow is the scrap calibration.
The two reference points are assigned real coordinates (0,0) and
(10, -15), since the
X axis points rightward and the Y axis points upward.
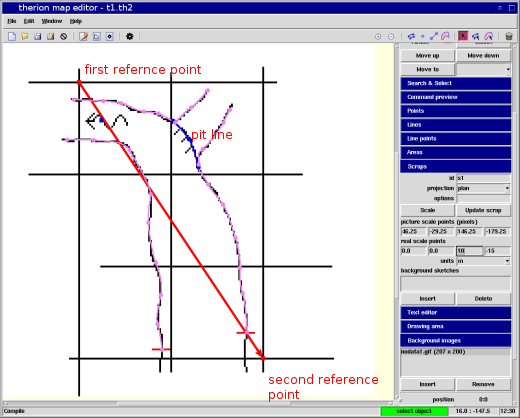
Fig. 67. Map import with reference points
4.6.3 Importing DXF/SVX
The conversion from Scalable Vector Graphics (SVG) to therion format
is not straightforward, because the SVG format is a generic format for
vector graphics while therion map files are specific for cave
information data.
Nevertheless, xtherion can import data from DXF/SVG files.
To do this go to the map editor and open a new file.
Then select the File->Import menu and choose the svg or dxf file
to import.
xtherion splits the centerline into pieces at branch nodes (stations
with three or more shots). It does not import the walls (from the DXF
file), but it imports the bounding box as a set of four separate lines.
J. Bohnert has written a Python script to convert SVG files to therion
th2 format. This script is available on the therion wiki.
The organization of cave data in the SVG file depends a lot
on personal taste: so is the choices of line widths, and the subdivision
of cave data on layers by the type.
The external script (or program) has more flexibility, than the simple
conversion implemented in therion, and can be easily adapted to
different way of organizing the information in the SVG file.
CorelDraw stores line data in relative coordinates. To convert it to
absolute coordinates you can load it in Inkscape and then save as
plain svg file. In the process you can filter out all the graphic
elements you do not need. In plain svg format lines are Bezier cubic curves,
with single points (prefixed by "M") or triplets with the point and the
control points (prefixed by "C").
Finally you must edit the Python script to adjust the xtherion
display zoom (line "##XTHERION## xth_me_area_zoom_to 2", where the
value is the zoom percentage), and the scrap scale (ie, the boundaries
of the scrap in the -scale option).
The author suggests the following conversion strategy: manually extract
all symbols of one kind (e.g. rocks, contour lines) using Inkscape and
save them as a separate th2 files with the correct line description.
Then combine everything in a single th2 file using a text editor.
4.6.4 Tracing
Line tracing is an xtherion feature to automatically create therion lines
by tracing lines on an map image. You start a new line and select a couple
of points on a map line. Next click on the "Line edit" option "Trace line":
xtherion start following the map line and adds points to the line. The
resulting line usually has very many points; to reduce their number and
make it smooth press the "Convert to curve" option.
Line tracing may at times fail as xtherion may get the wrong continuation
at a point where another line come close to the one that is being traced.
In this case split the line. at the last good point, delete the extra piece,
add some points and continue tracing (button "Continue tracing").
The result depends on the quality of the map; it's better if the map lines
are neat and with good contrast. If the map line is greyish the tracing easily
goes off the line. It works rather well to digitize contours of topographical
maps, or to convert old cave maps to therion.
It is useless for muddy cave sketches. There are problems with acute angles.
The viewing resolution (zoom) also affects the result.
Coverting a line to a curve (button "Convert to curve") works for any line,
not just for traced lines. Therefore you can enter a line setting many points
and then let xtherion convert it to a smooth curve.
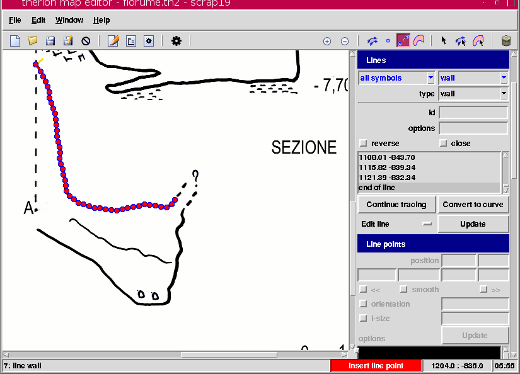
Fig. 68. Traced line
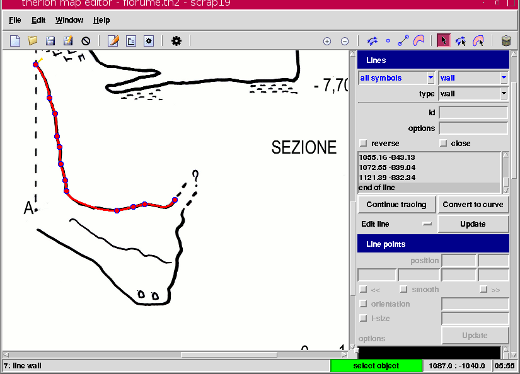
Fig. 69. Traced line coverted to a curve
4.6.5 The examples
therion users - Sun Jun 10 08:23:48 2012
Prev Up Top Next Contents
This work is licensed under a Creative Commons
Attribution-NonCommercial-ShareAlike 2.5 License.